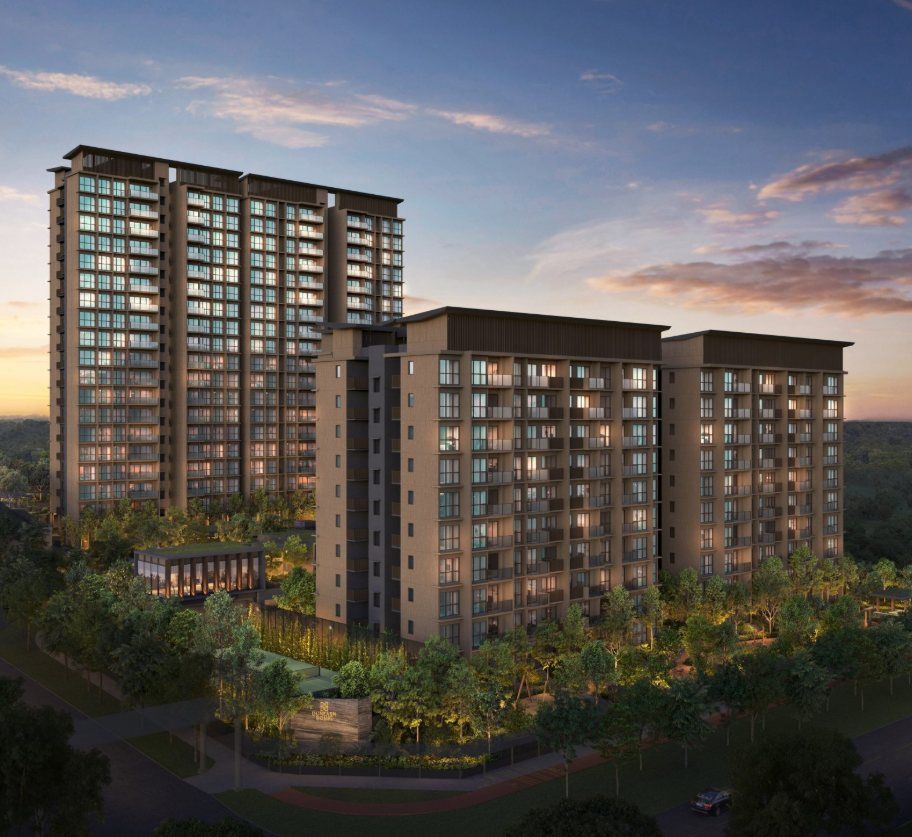
Buyers and sellers in the real estate market need accurate data to make informed financial decisions. When evaluating properties like Lucerne Grand, relying on gut feelings or outdated list prices can lead to costly mistakes. Fortunately, digital tools make it easy to access historical sales data from the comfort of your home. Knowing how to find and analyze these records ensures you pay a fair price or sell at a competitive rate. This guide explains how to research past condo transaction prices online, helping you understand market trends, evaluate specific developments, and negotiate with confidence.
Utilizing Official Government Portals
The most reliable starting point for researching Singapore property transactions is the Urban Redevelopment Authority (URA) portal. The URA transaction tool provides actual transacted prices based on caveats lodged with the Singapore Land Authority. This database offers transparent, unbiased information directly from official records.
Accessing the URA Database
To begin your research, access the URA portal and input the name of the project you want to analyze. For instance, if you look up a development like the Thomson Reserve condo, you can view the transaction history over the past several years. The search results display crucial details, including the contract date, property size in square meters or square feet, unit level, and the transacted price.
Establishing a Valuation Baseline
This raw data forms the foundation of your market research. Government portals update this information regularly, typically every Tuesday, ensuring you have access to the latest market movements. By comparing transacted prices of similar-sized units within the same district, you establish a realistic baseline valuation. Using official channels protects you from inflated asking prices, giving you an objective view of what buyers paid. Additionally, pay attention to land tenure and building age, as these factors influence the overall value. Comparing older leasehold properties with newer freehold ones in the same neighborhood helps you understand the premium buyers pay.
Deciphering Caveat Data and Unit Characteristics
Raw transaction numbers only tell part of the story; you must analyze the specific characteristics of each transaction to draw accurate conclusions. A caveat represents a legal document lodged by a buyer to protect their interest in a property, and it records the exact price agreed upon.
Evaluating Floor Levels and Layouts
When reviewing these documents for a boutique development like Lucerne Grand, look closely at the unit level or floor range. Typically, units on higher floors command a premium due to better views, less street noise, and improved ventilation. If you see a sudden dip in transaction prices, check if those sales occurred on lower floors or involved units with less desirable layouts.
Analyzing Price Per Square Foot
Furthermore, analyze the price per square foot (PSF) alongside the absolute price. Sometimes, a smaller unit has a high PSF but a lower absolute price, making it attractive to investors but less practical for large families. By breaking down the data by floor level, unit size, and transaction date, you can identify patterns that explain price variations. This detailed analysis prevents you from making inaccurate assumptions based on a single high or low transaction, ensuring your valuation aligns with the physical reality of the property.
Leveraging Commercial Property Portals
While government databases offer raw transaction data, commercial property portals provide user-friendly visualization tools that simplify your analysis. Websites such as EdgeProp, SRX, and PropertyGuru aggregate URA data and present it in interactive charts and graphs.
Comparing Multiple Developments
These platforms allow you to compare multiple developments side-by-side, which is highly beneficial when deciding between different neighborhoods. For example, you can compare historical price appreciation trends of the Thomson Reserve condo against other projects in the same district over a five-year period. These tools often calculate the average rental yield, capital gain percentages, and historical price gaps automatically.
Utilizing Advanced Analytical Features
Many commercial sites also offer heat maps that show which areas are experiencing the highest price growth. However, always verify the data on these third-party platforms against official URA records, as minor discrepancies can occasionally occur during data synchronization. Using commercial portals saves time and helps you identify broader market trends that might not be immediately obvious when looking at a spreadsheet of raw numbers. They bridge the gap between complex data and practical decision-making for everyday buyers. Many of these websites also offer email alerts or notifications when new transactions are recorded in your favorite developments. This feature allows you to monitor the market continuously without manually searching the database every week.
Spotting Price Trends and Market Anomalies
When researching historical transaction prices, you will occasionally encounter anomalies that do not align with general market trends. These outliers can distort your understanding of a property’s true value if you do not analyze them carefully.
Identifying Transaction Outliers
For instance, a unit in Lucerne Grand might transact at an unusually low price due to a parent transferring ownership to a child, or a seller facing urgent financial pressure. Conversely, a record-high transaction in the Thomson Reserve condo might involve a fully renovated penthouse sold with premium furnishings. To avoid being misled by these anomalies, look at the median transaction price over a six-to-twelve-month period rather than focusing on the absolute highest or lowest points.
Considering Broader Market Context
A steady upward or downward trend in median prices offers a much more reliable indicator of market direction than isolated transactions. Additionally, consider external economic factors, such as changes in interest rates or new cooling measures introduced by the government, which can cause temporary shifts in buyer behavior. Understanding the context behind the numbers ensures you do not overpay during a market peak or undervalue your asset during a temporary dip. Always cross-reference the transaction volume as well. A high volume of transactions indicates a highly liquid and active market, whereas low transaction volume means a single unusual sale can heavily skew local averages.
Conclusion

Researching condo past transaction prices online is an essential step for anyone looking to buy or sell property in a competitive market. By utilizing official government portals, understanding caveat details, and leveraging commercial analytical tools, you gain a clear picture of fair market value. Whether you are evaluating a specific development or analyzing broader trends in popular residential districts, data-driven research protects your financial interests. Taking the time to study historical trends, identify market anomalies, and compare similar properties ensures you can enter negotiations with confidence and make informed decisions that align with your long-term real estate goals.